Execution Dashboard
Use this page during weekly/monthly reviews. Enter current performance values to see progress vs plan. Data is stored locally in your browser (no server).
Progress vs Annual Target
As of —
₹0 achieved
Target: ₹1,00,00,000
0% complete
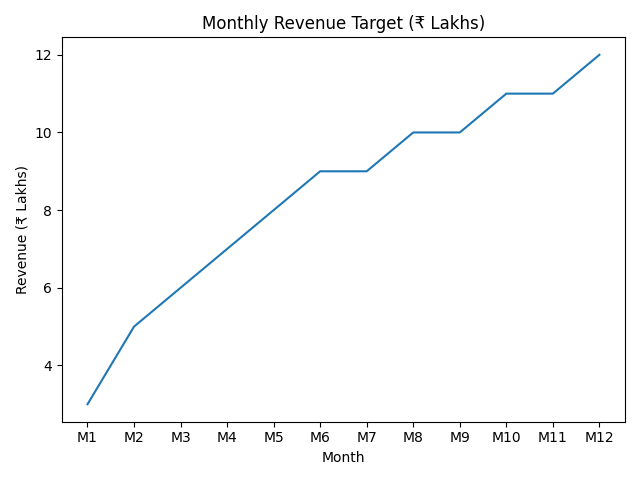
Suggested run-rate: ₹8–12L/month by Month 6–8. Use the Monthly Target table in Revenue Plan for month-wise calibration.
Conversion: —
AOV (₹): —
DSO status: —
Notes: Conversion is computed as Orders ÷ Leads. AOV is estimated as Monthly Revenue ÷ Orders (if you enter Month Revenue below).
Monthly Revenue Snapshot
Inputs
Use this for current month review. The plan expects a ramp from ₹3L (M1) to ₹12L (M12).
Quick Targets
Baseline- Leads/month: 400–600
- Qualified/month: 150–250
- Orders/month: 40–60
- DSO: < 30 days
- Repeat rate: > 40%
Product Acceptability Map
Click a stateSelect a state
Use this to align dealer onboarding and inventory by region.
Keep Year-1 geography tight: 6–8 states, 3–5 hero SKUs per state.
Visuals (from Graphs page)
AutoMonthly Revenue Ramp (₹ Lakhs)
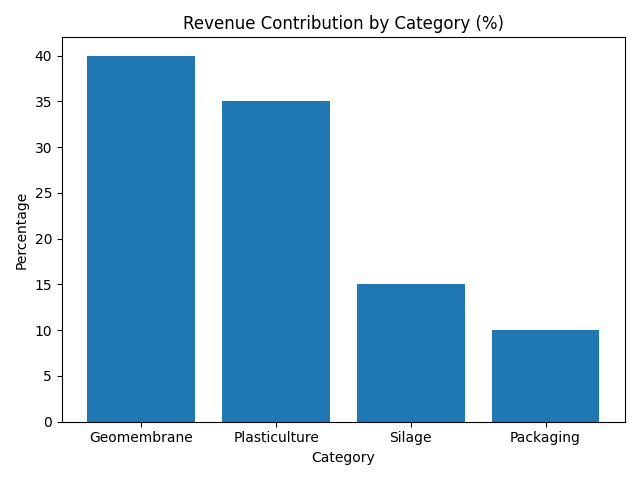
Category Split (%)
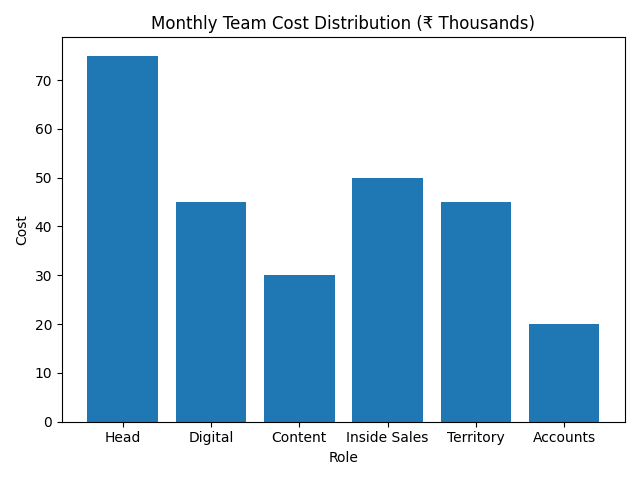
Team Cost Distribution (₹ Thousands)
If images do not load: ensure the ZIP is extracted and you are opening files from the extracted folder.